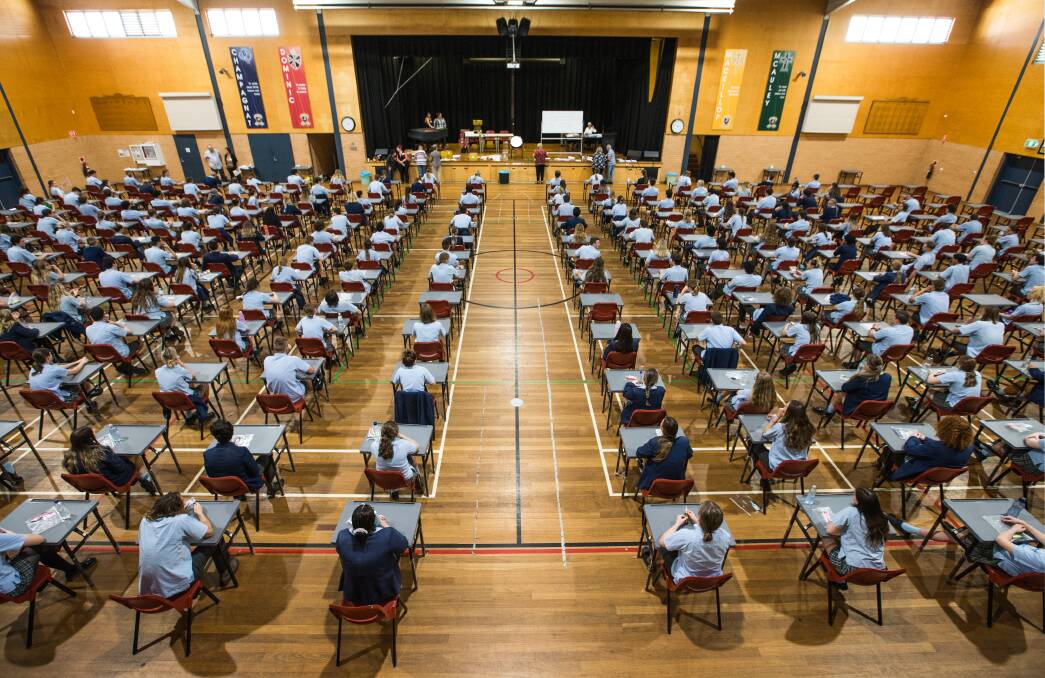
 The HSC journey represents one of the most demanding periods for an adolescent, with increased workloads, reduced sleep, and high-performance expectations, all contributing to elevated anxiety levels. In the lead up to exams, students typically study 2-3 hours per day rising to 5-6 hours during trials and final examination periods. (The Typical Study Hours of a HSC Student, 2019). These extended study demands often lead to families prioritising academic preparation over exercise. However, research shows reduced movement during high-pressure periods is consistently associated with heightened stress, poorer emotional regulation, and disrupted sleep (Vandekerckhove & Wang 2017). (See Figure 1)
This is particularly relevant in Australia, where young people aged 16-24 experience the highest rate of psychological distress, with anxiety disorders being the most prevalent mental health condition of this age group, affecting almost one in three adults (AIHW, 2023). A survey of year 12 students found that 42% report significant stress and anxiety during the HSC, highlighting the importance of strategies that help adolescents mange this stressful period. (North et al., 2015)
Understanding this issue is important for parents because anxiety during late adolescence has implications beyond immediate exam performance. Elevated stress during this developmental period is associated with long term risks, including persistent mood and anxiety disorders, reduced academic engagement and more difficult transitions into university or employment. (Stromájer et al., 2023) Yet, regular exercise helps reduce these effects, by regulating cortisol, improving sleep quality, and supporting cognitive function such as attention and working memory (American Psychological Association, 2020). Recognising the value of exercise provides parents with practical insights to support their child’s wellbeing and reduce anxiety throughout the HSC year.
James Petrakis


