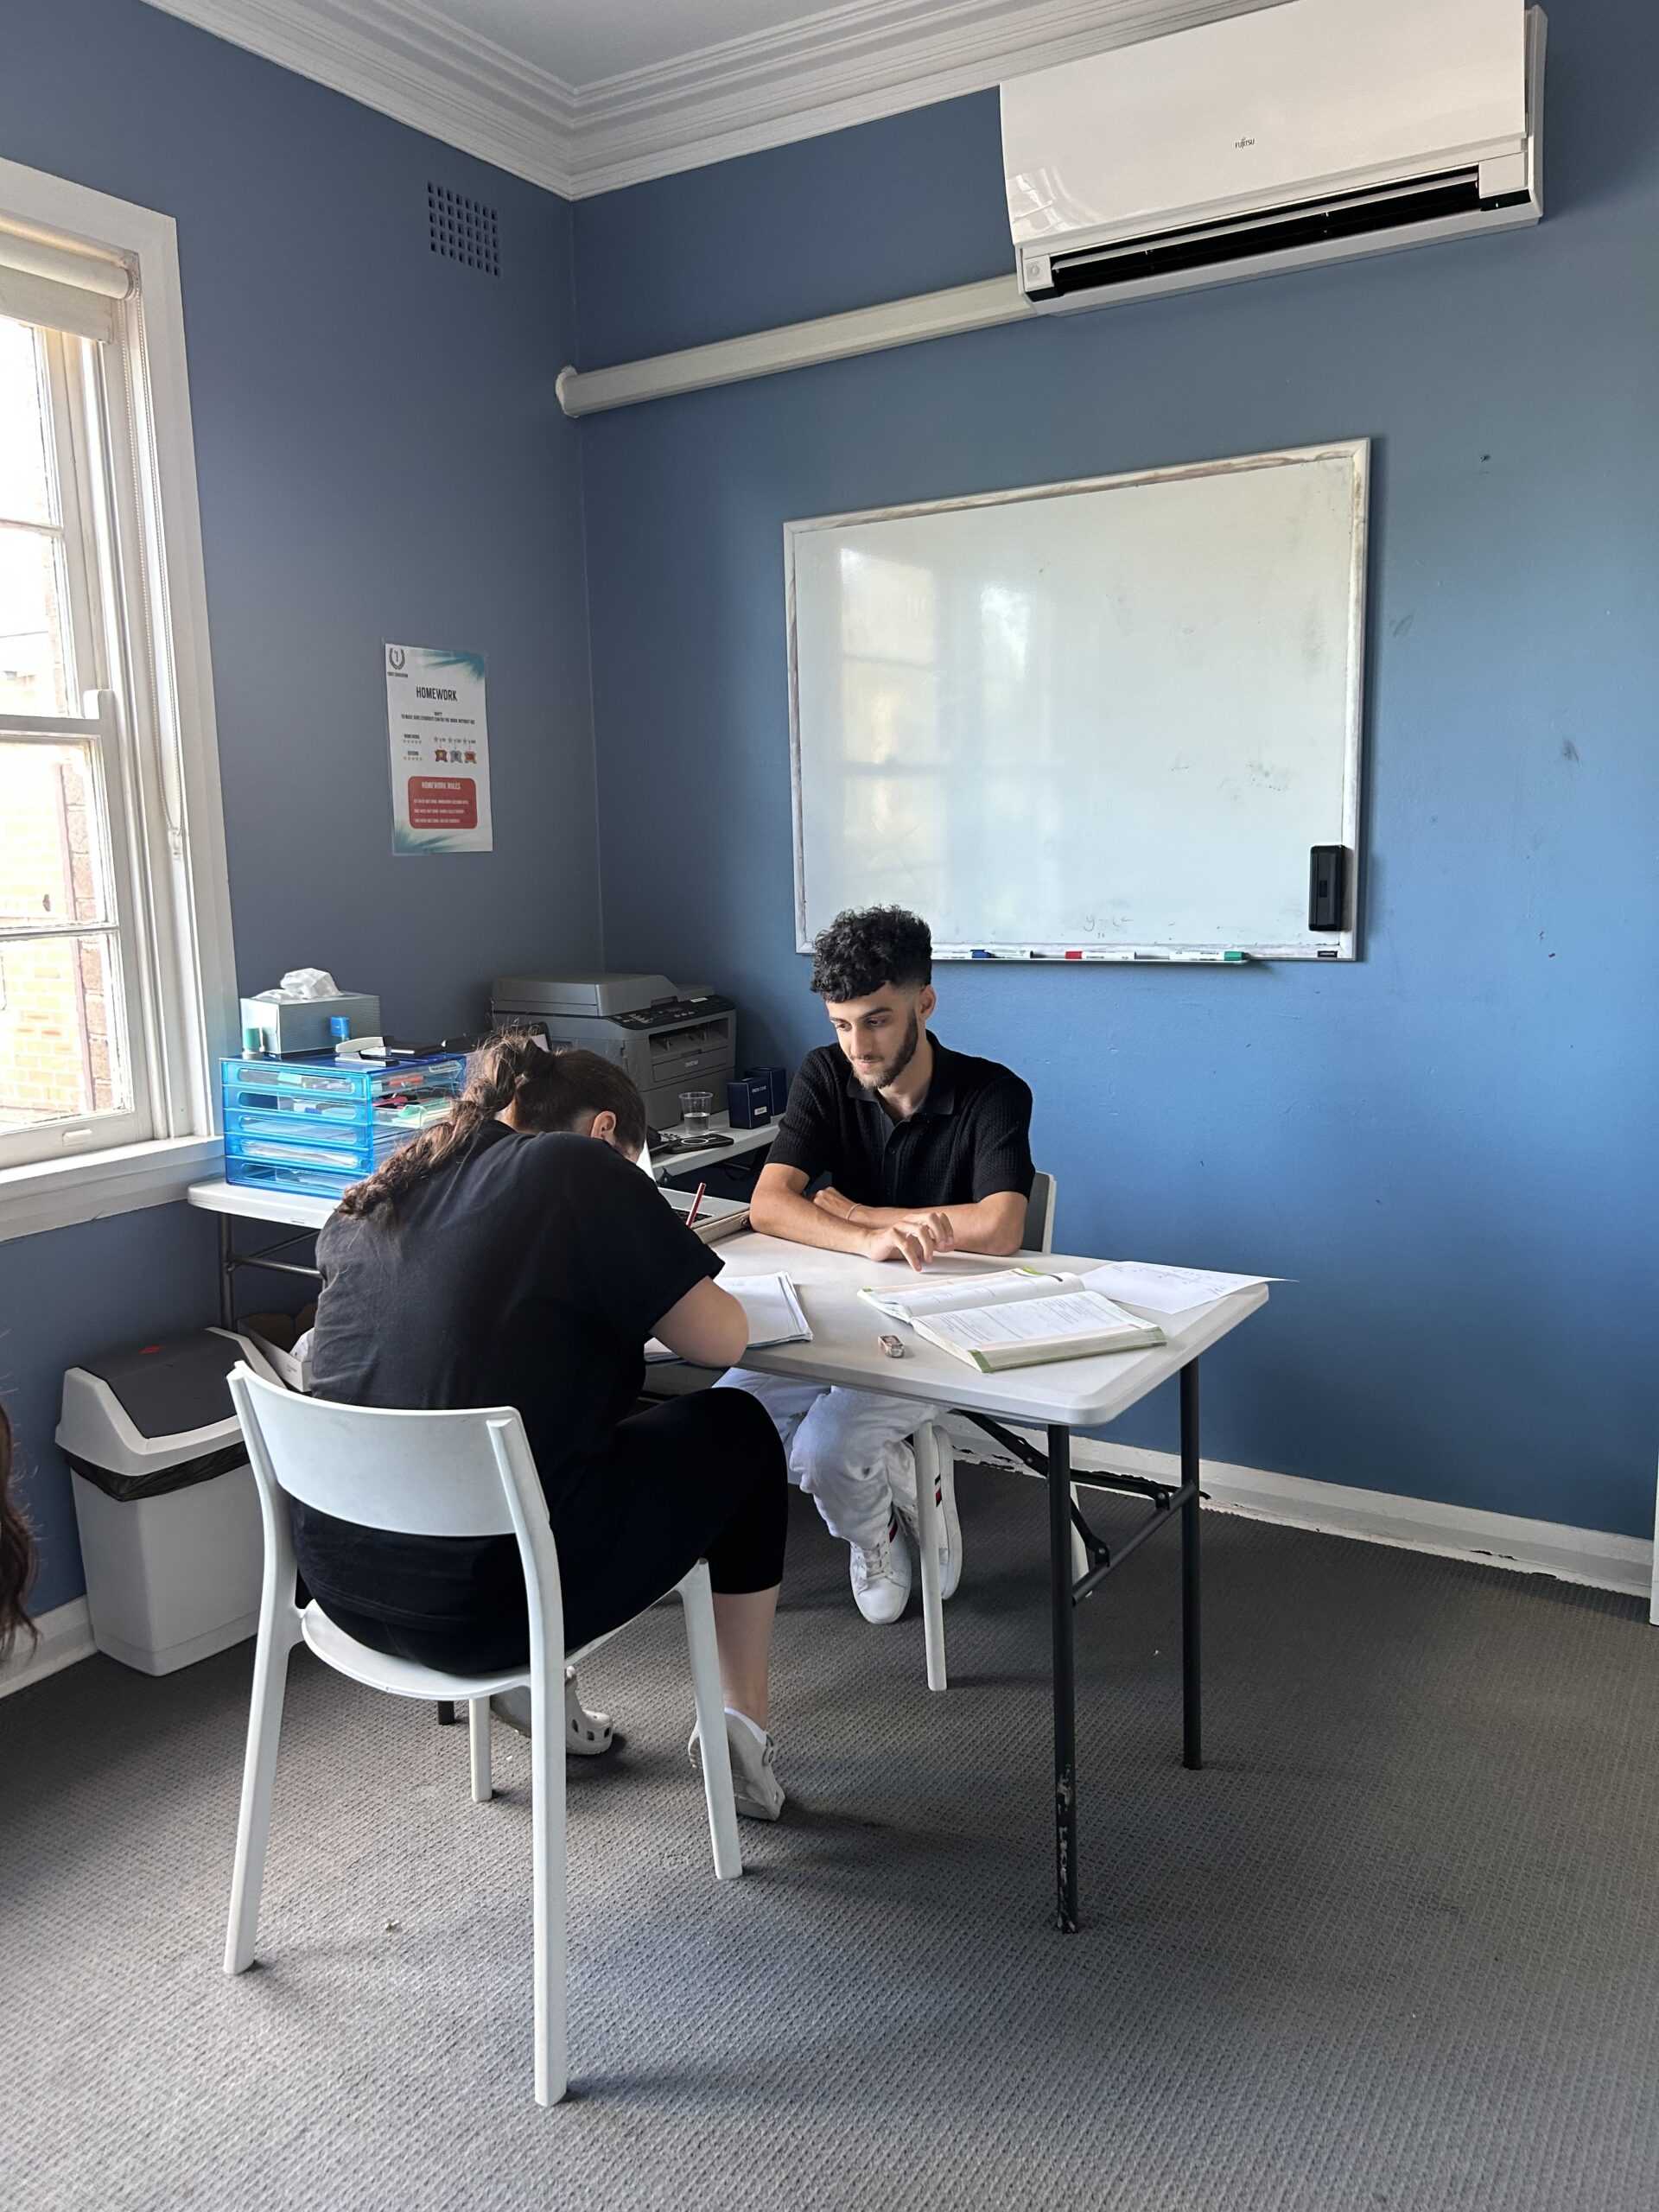
Today I had the opportunity to observe Joseph with his year 10 Maths student Melody, helping her with numbers and statistics topic, specifically box plots. He used a range of strategies to keep the lesson engaging and make sure Melody was supported and involved throughout.
To kick things off, Joseph broke the concept into easy-to-understand steps. He went over the basics first—median, quartiles, and range—to make sure Melody had a good foundation. Then, he used familiar examples, like school sports results and test scores, to show how box plots can be useful in real life, which I thought was quite helpful.
Joseph used a mix of visual and hands-on techniques to explain the content. He showed Melody how to draw a box plot on the whiteboard, breaking down each part—the minimum, maximum, quartiles, and interquartile range. Then, he had Melody create her own box plot using a dataset, guiding her through it while letting her take charge.
Midway through the session, Joseph suggested a quick break, and they played a short game of Uno. It gave Melody a chance to relax and reset before diving back into the work.
After the break, Joseph challenged Melody to interpret completed box plots, asking her to point out patterns and compare data sets. When she got stuck, he rephrased the questions or gave her a small nudge in the right direction. To wrap up, he gave her a mix of practice problems, starting with simpler ones and building up to more challenging tasks.
The combination of clear explanations, practical examples, and the relaxed break with Uno helped keep Melody engaged and confident. By the end of the session, she’d made solid progress and was feeling much more comfortable with box plots. I’ll certainly be making sure to incorporate a few of these strategies in my sessions. Thanks Joseph.
Eric Mihas

