
We don't have online enrolment because we'd like to talk to you first.
Please fill this in the form below, and then we'll walk the walk.
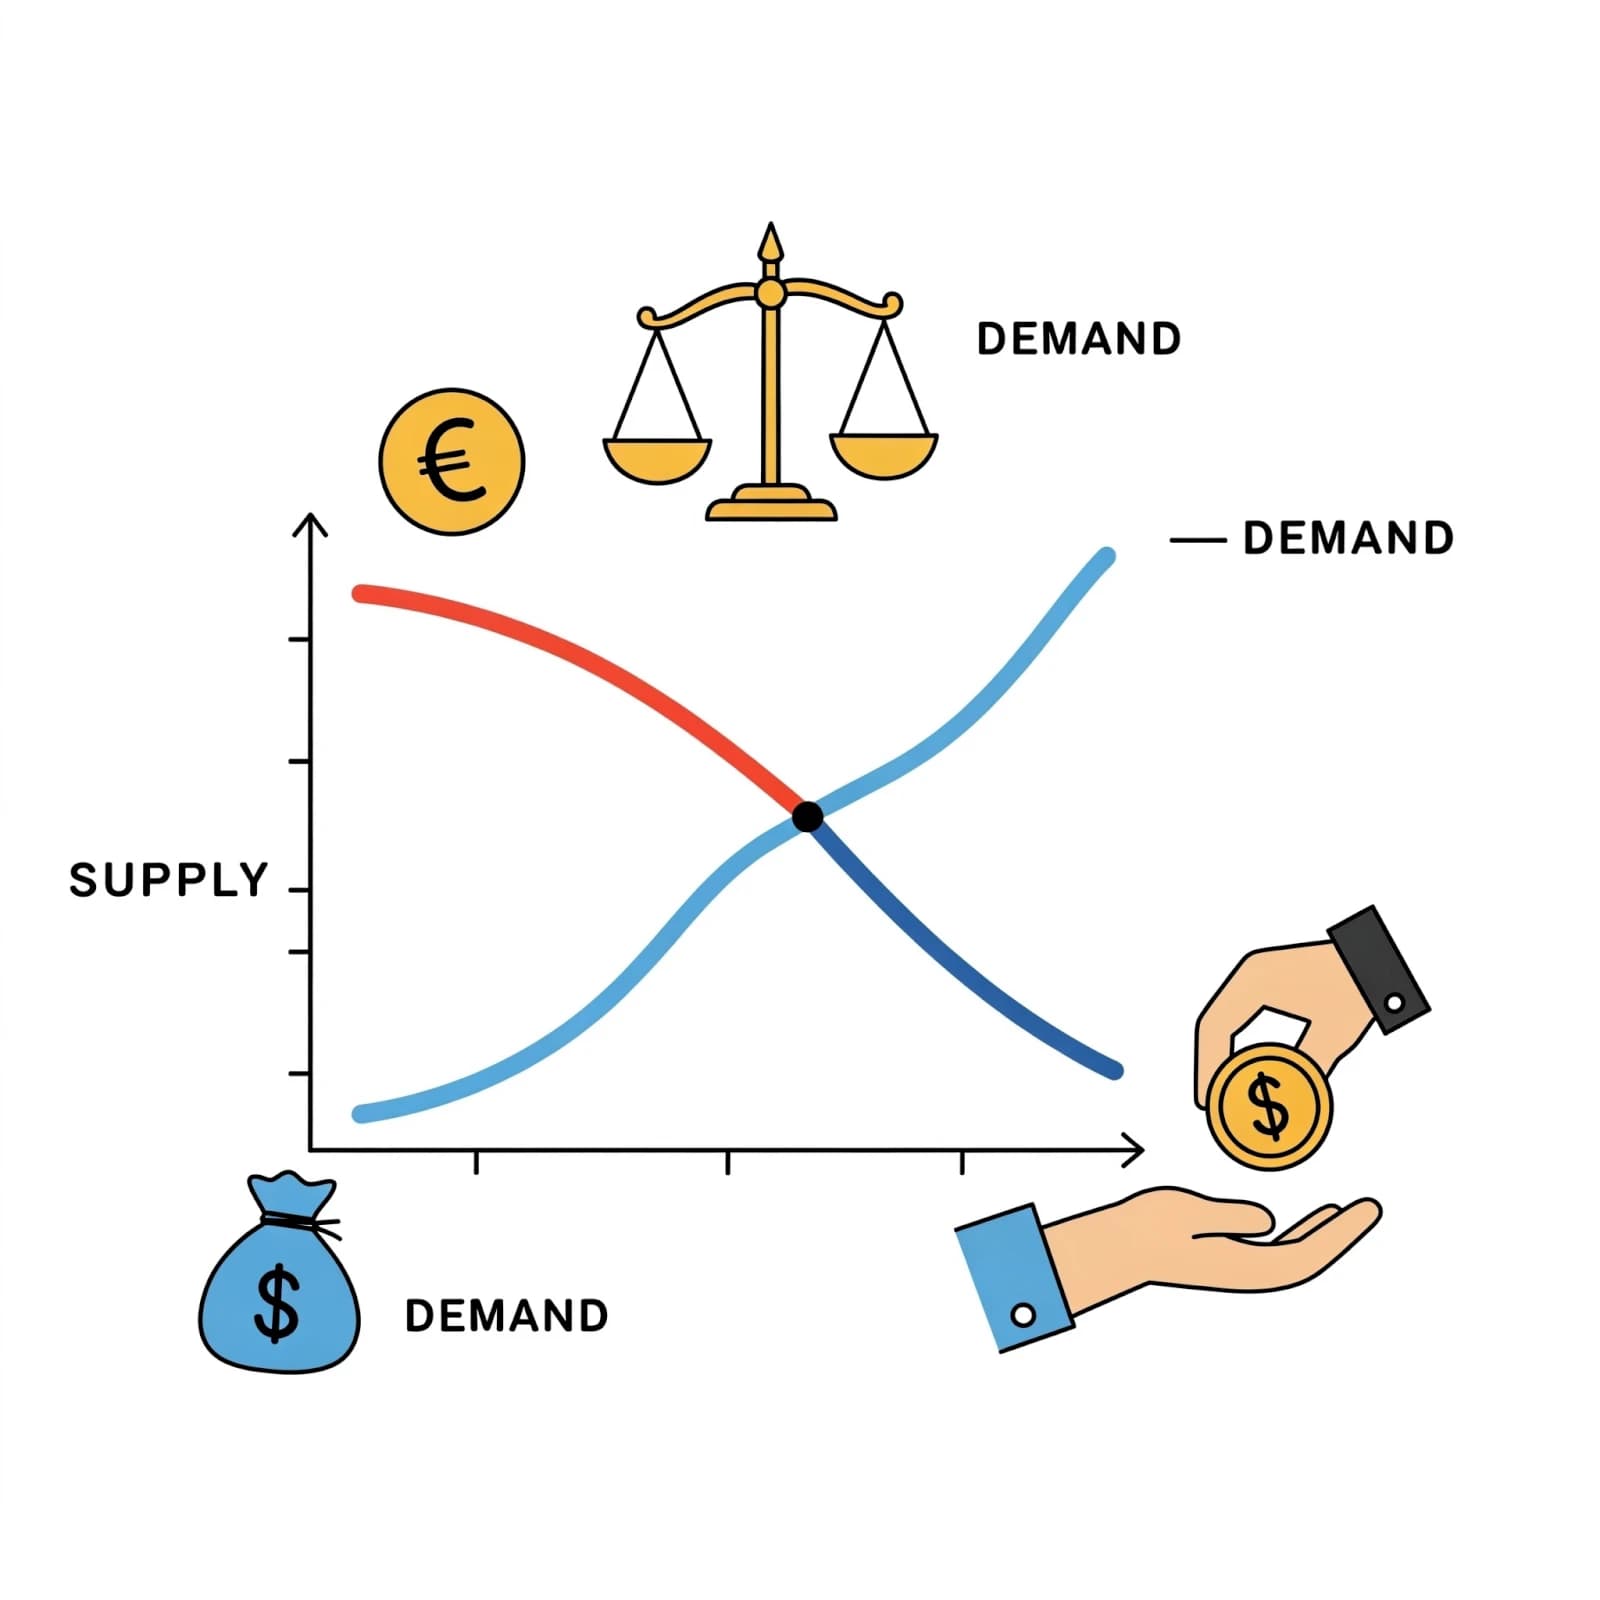
A well-drawn and explained graph is the easiest way to show an HSC marker that you understand the content in HSC Economics. A correctly labelled and analysed diagram can assist in elevating an essay paragraph from average to excellent. It is something that adds a backbone to your theory and stats, making it a real-world example.
In an exam, you will be under time pressure, so it is important that including these graphs is an automatic process that comes to you straight away. These three graphs come up again and again throughout the course, so it is imperative that you commit them to memory!
1. Aggregate Demand and Supply (AD/AS)
This is a classic when it comes to macro and microeconomics. Essential when explaining economic growth, demand-pull and cost-push inflation, and the impact micro reform can have on AS and the price level.
Downward-sloping demand with upward-sloping supply. GDP on the x-axis and price on the y-axis. Make sure you are highlighting an increase/decrease in AD or AS.
2. Tariff Diagram
One of the big players when it comes to protection. Draw a downward-sloping demand curve and an upward-sloping supply curve. Add a horizontal line at the world price, and then another horizontal line at the world price + tariff (an increase in the world price by the size of the tariff). It is important to acknowledge that the gap between quantity demanded and quantity supplied at the world price + tariff is the amount of imports into the economy, with government revenue being the size of the tariff x imports.
3. Lorenz Curve
Very important when looking at the distribution of income and wealth. You should draw a perfect line of equality at 45 degrees from the origin of the x and y-axes, then draw a curve bowing below it. The closer the curve is towards the line of equality represents a more even distribution of income, whereas the farther it is, the more unequal.
These three graphs are absolutely critical and can go a long way towards elevating your mark!


Ready when you areReach out anytime
Leave your details and we'll call you back, or send us a message. It's just a friendly conversation to get started.
We don't have online enrolment because we'd like to talk to you first.
Please fill this in the form below, and then we'll walk the walk.